Big Simulation Architecture

06.24.2016

Game of Life with syd

I've been interested in extending the work on Humans of Simulated New York into a more general agent-based simulation framework, one that is both accessible to non-technical audiences and powerful enough for more "professional" applications as well. We are all so ill-equipped to contend with the obscenely complex systems we're a part of, and we end up relying on inadequate (and often damaging) heuristics that cause us to point blame at parties that either have little do with our problems or are similarly victimized by them. Maybe if we had tools which don't require significant technical training to help us explore these causal rat's nests, to make this insane interconnectedness more intuitive and presentable, we could think through and talk about these wicked problems more productively.

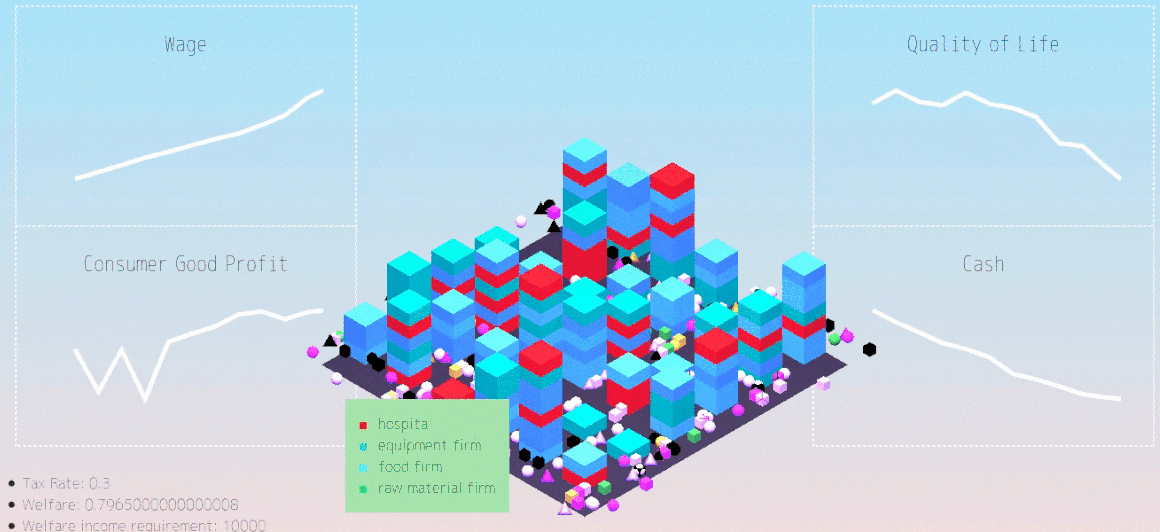
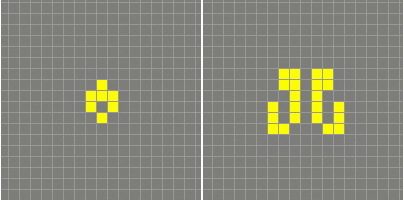
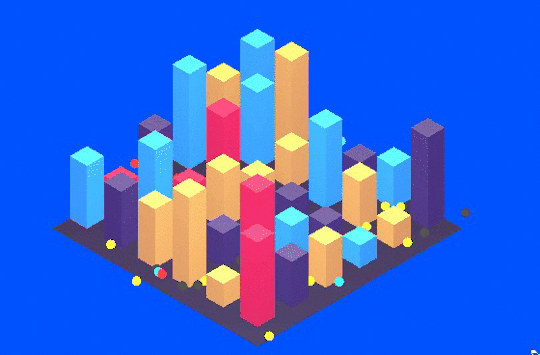
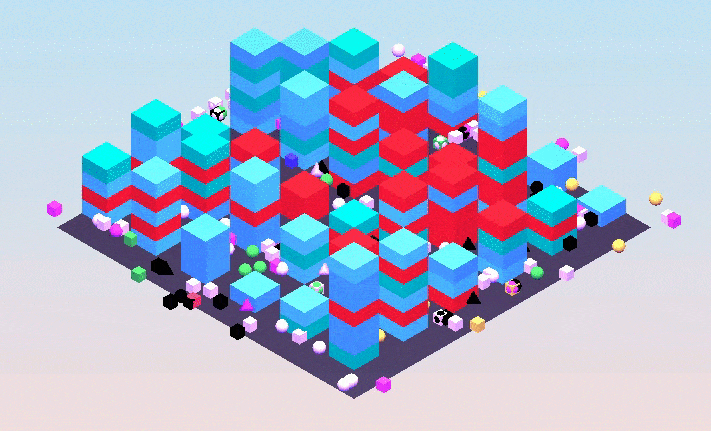
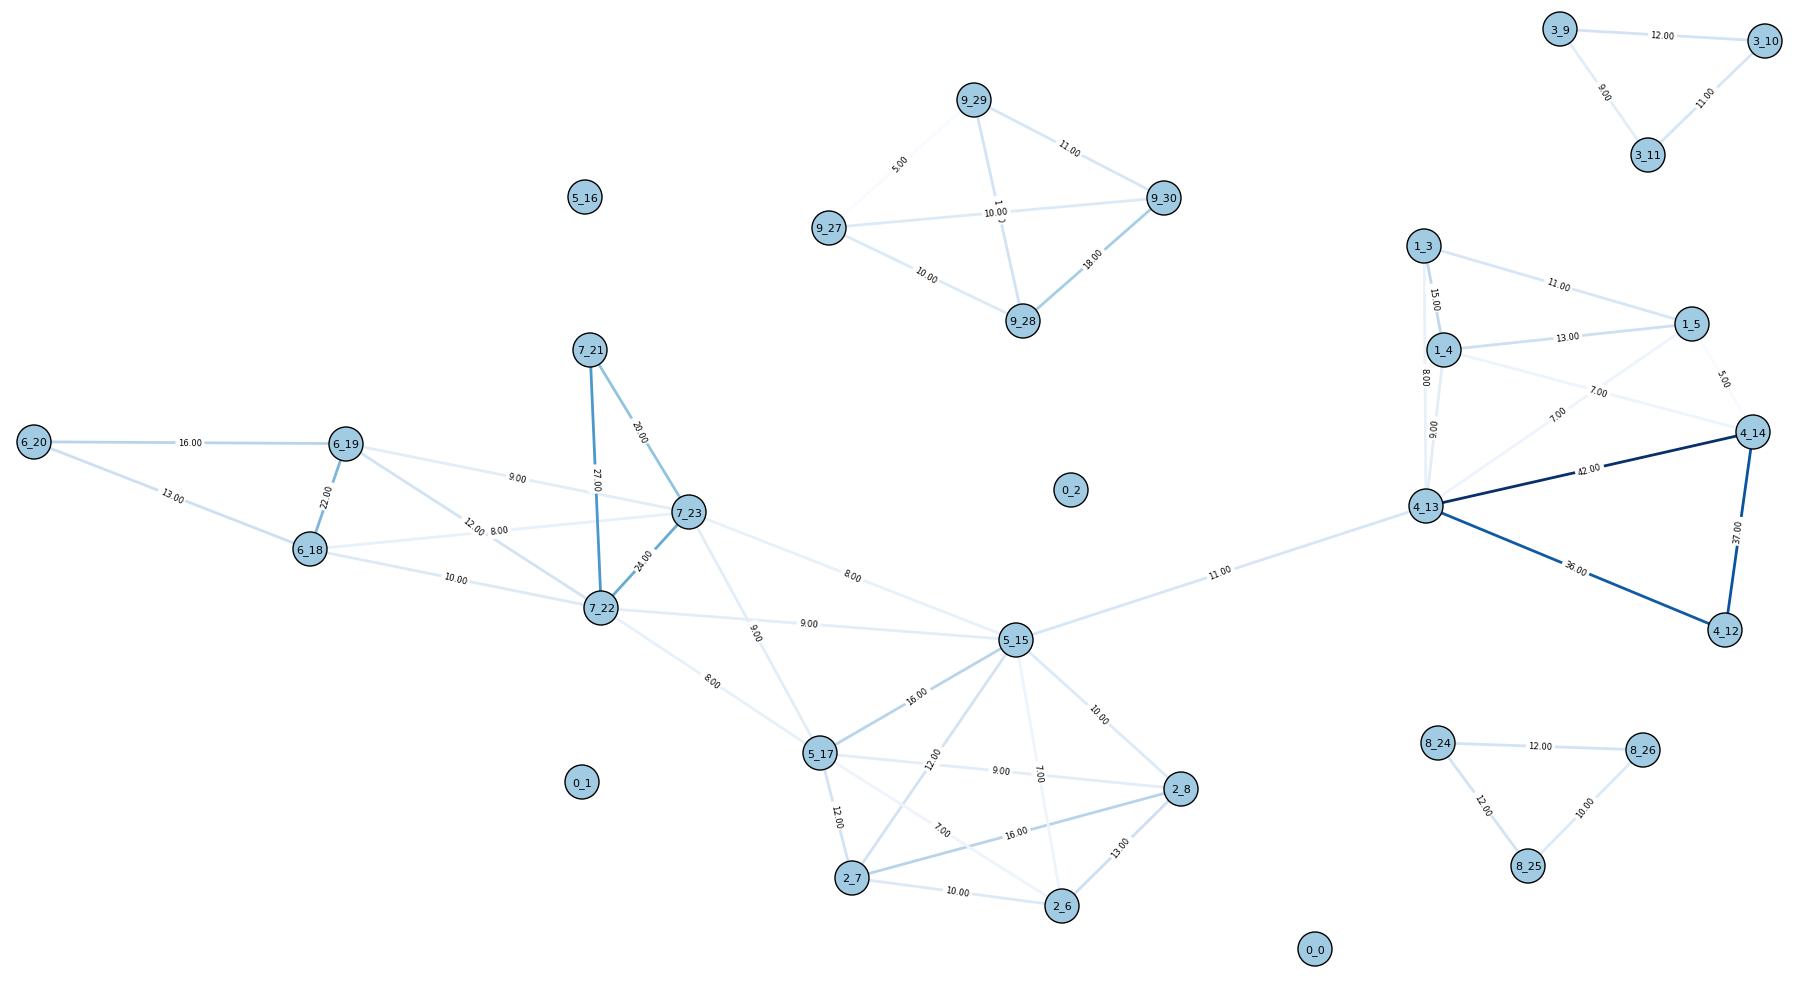
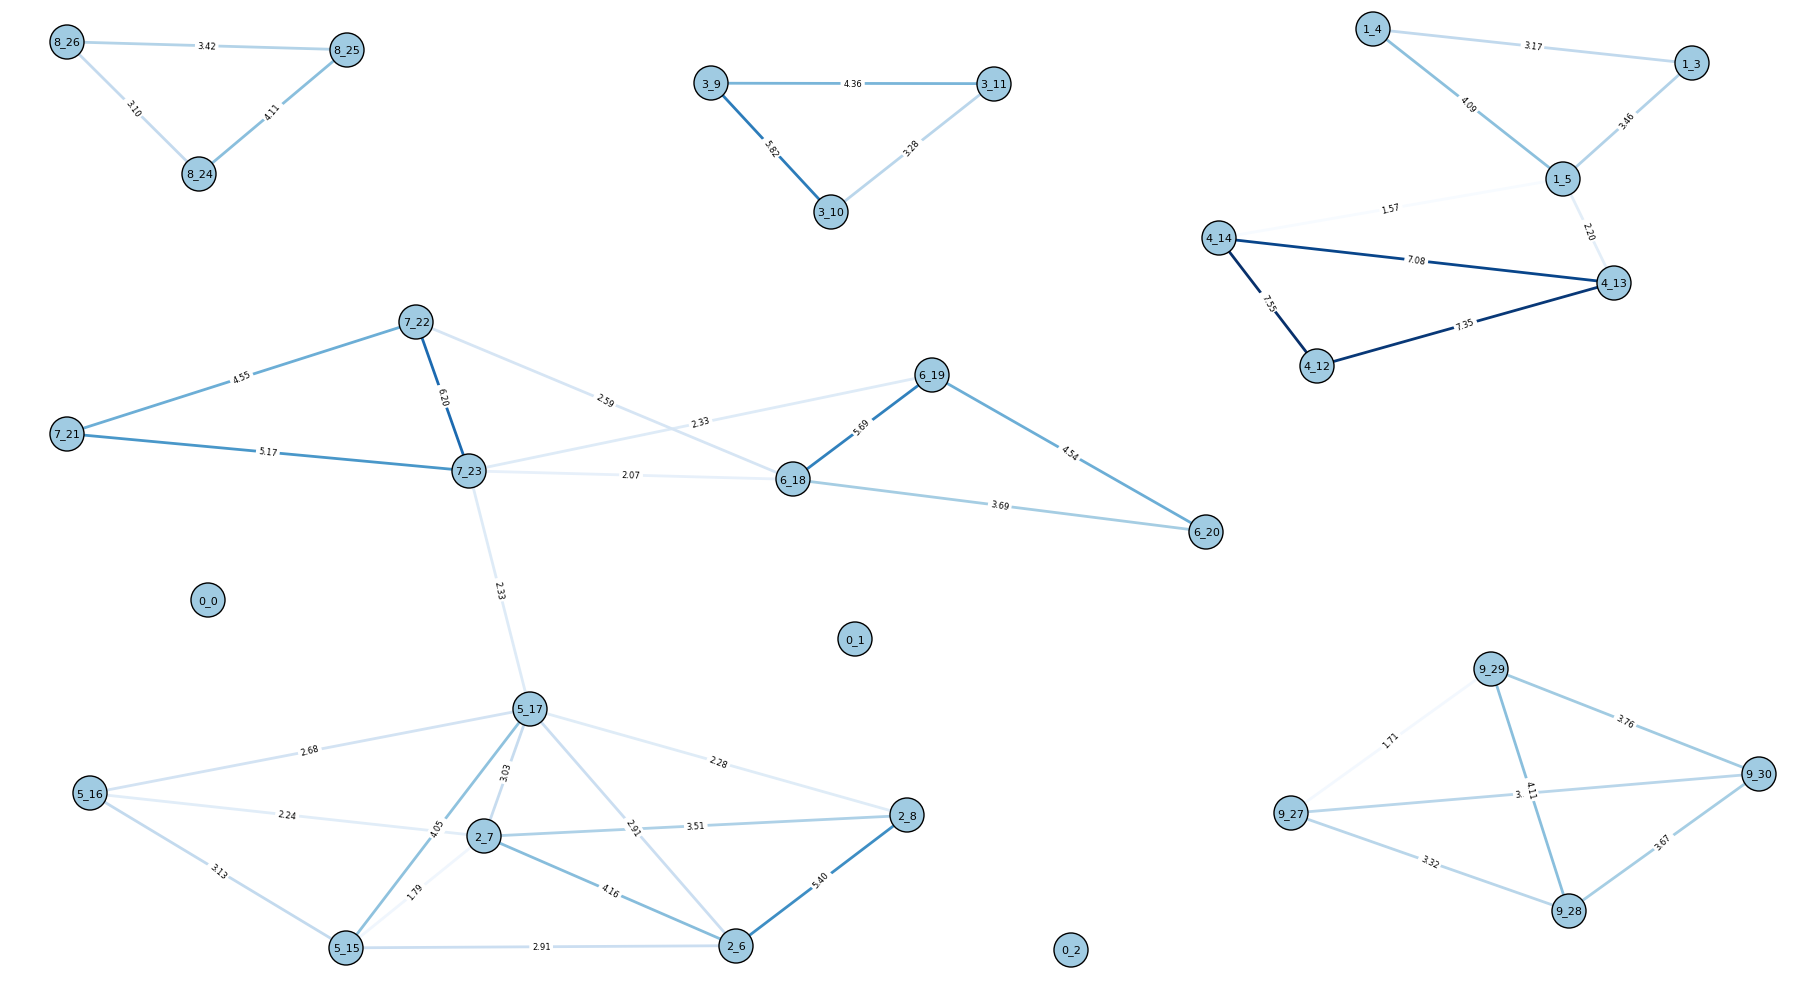
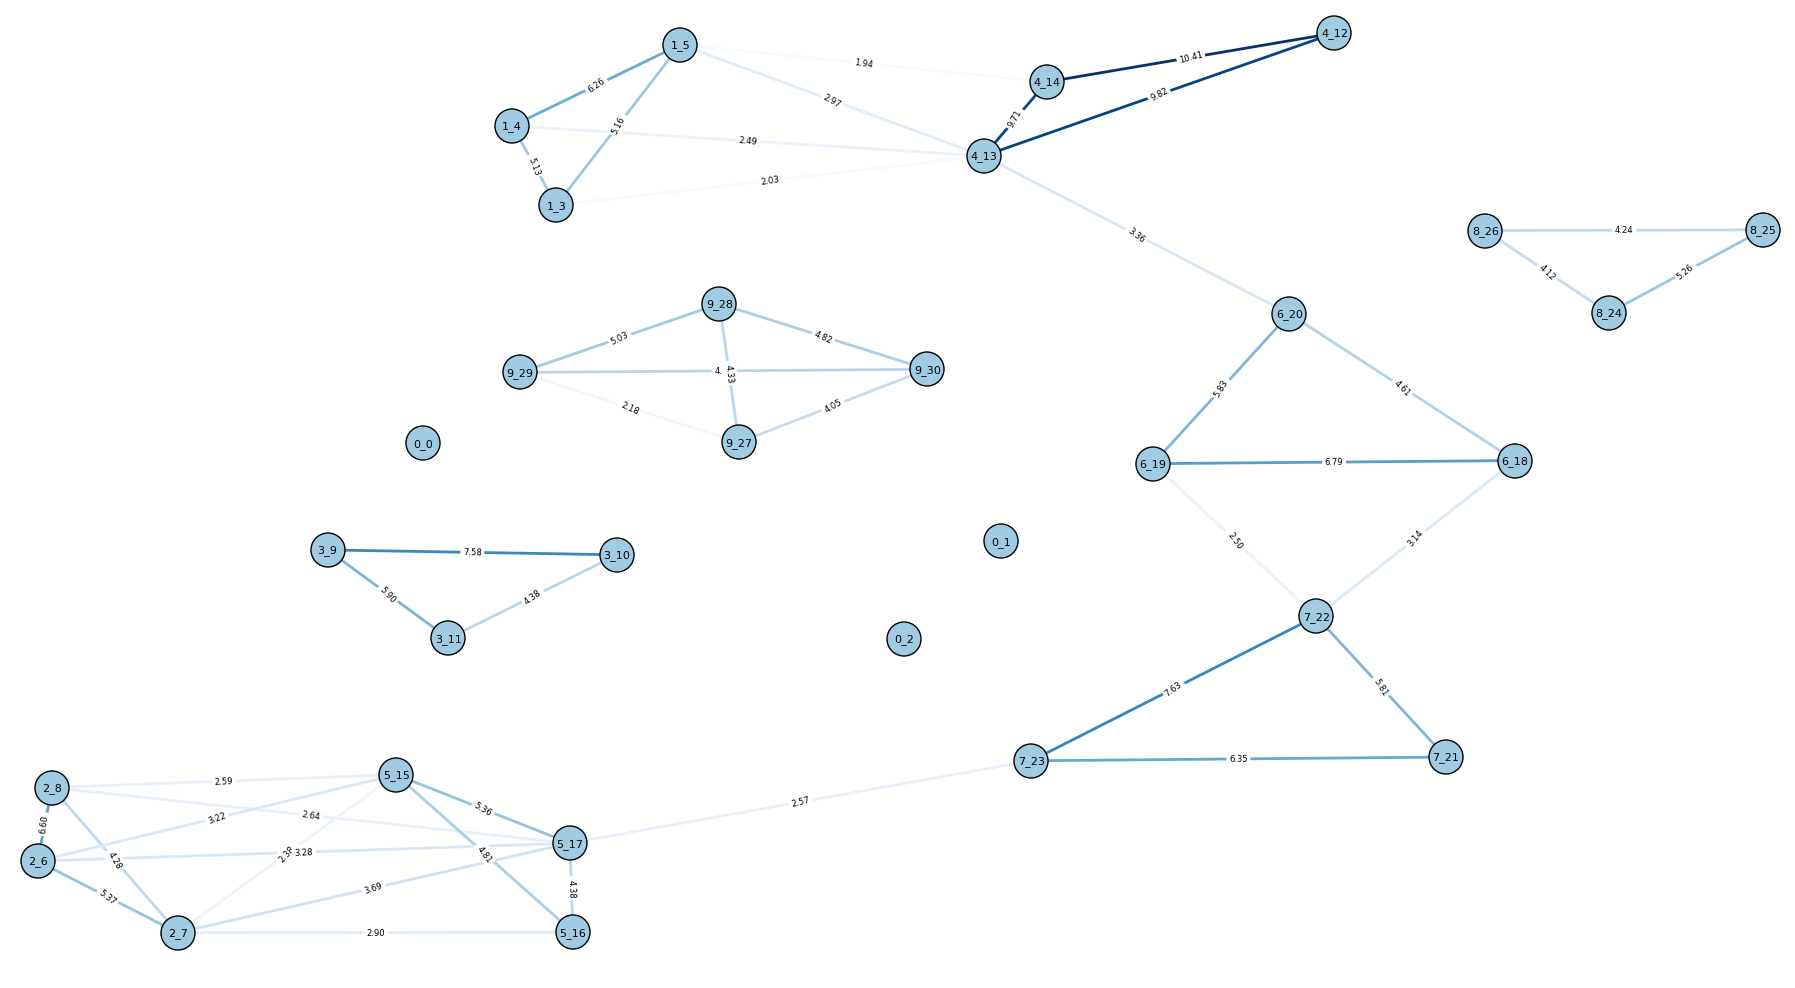
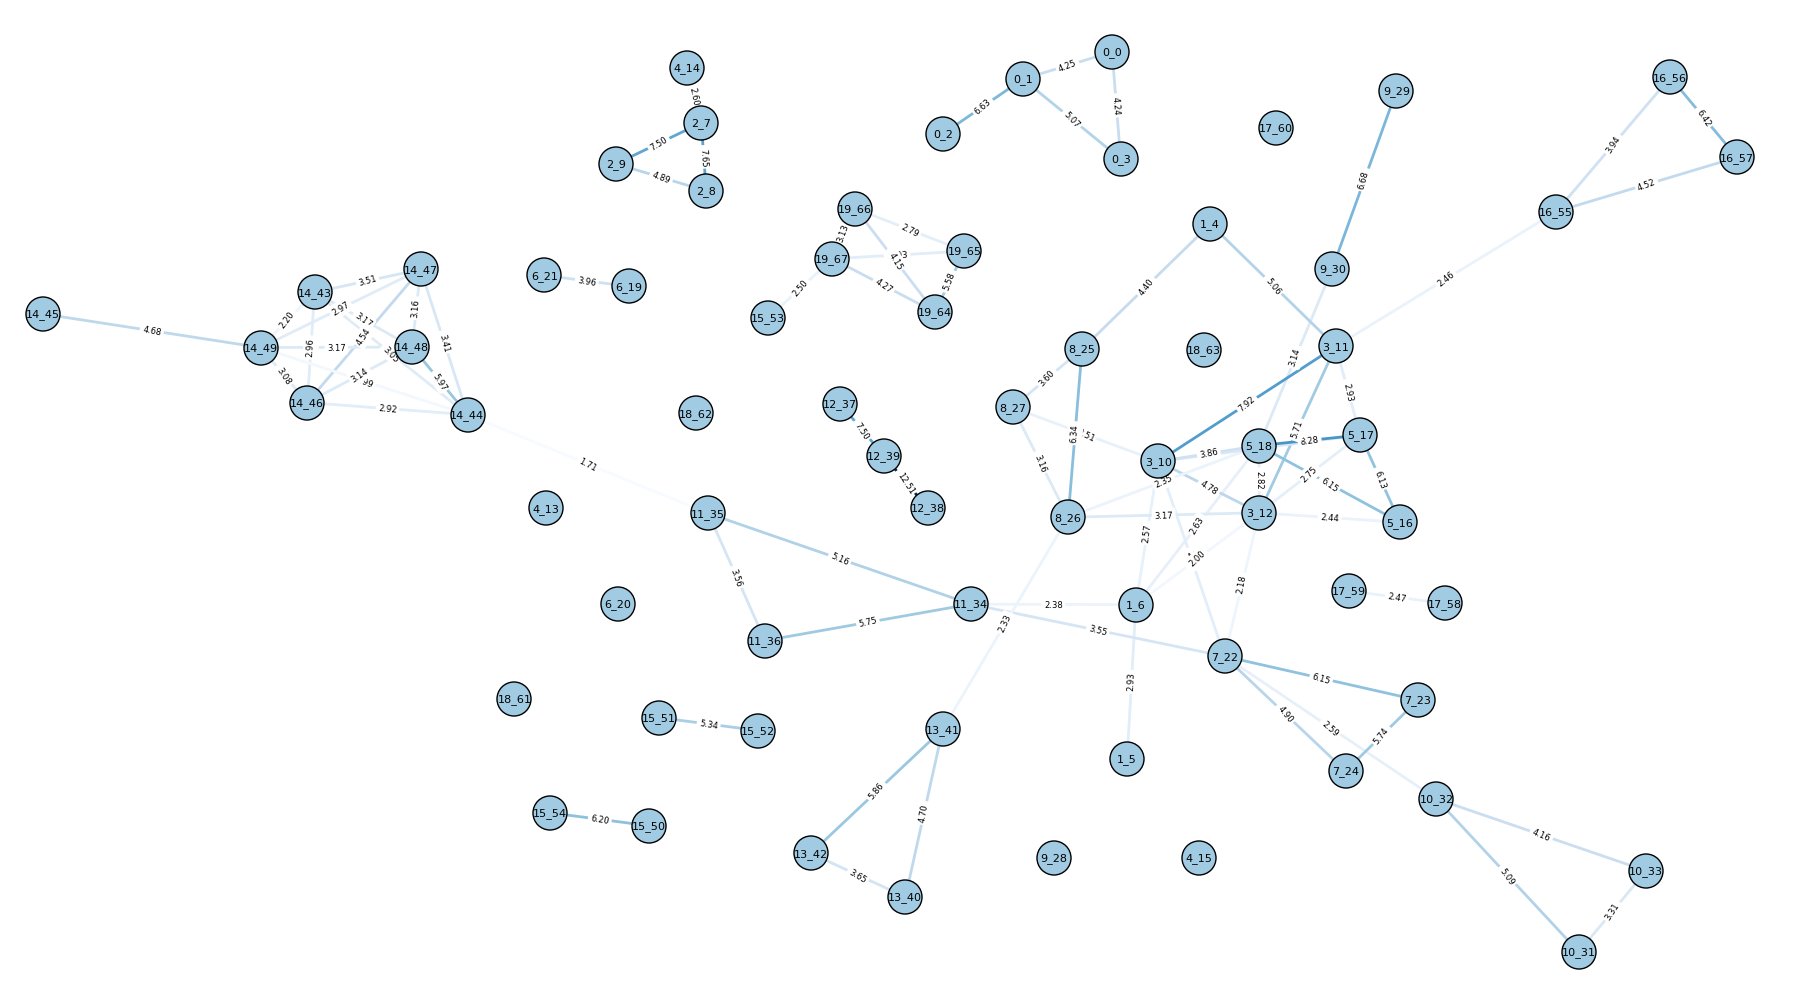
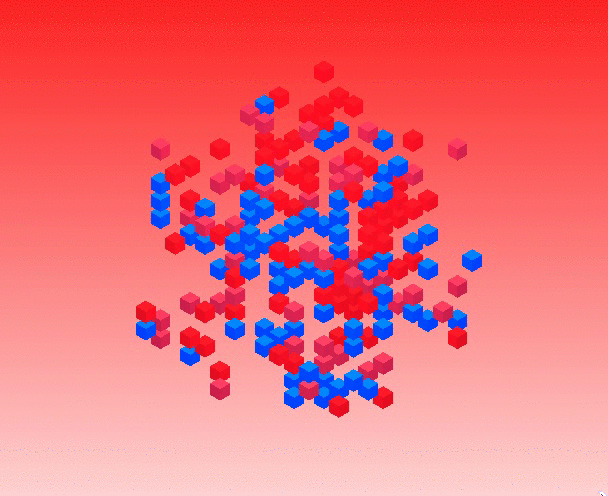
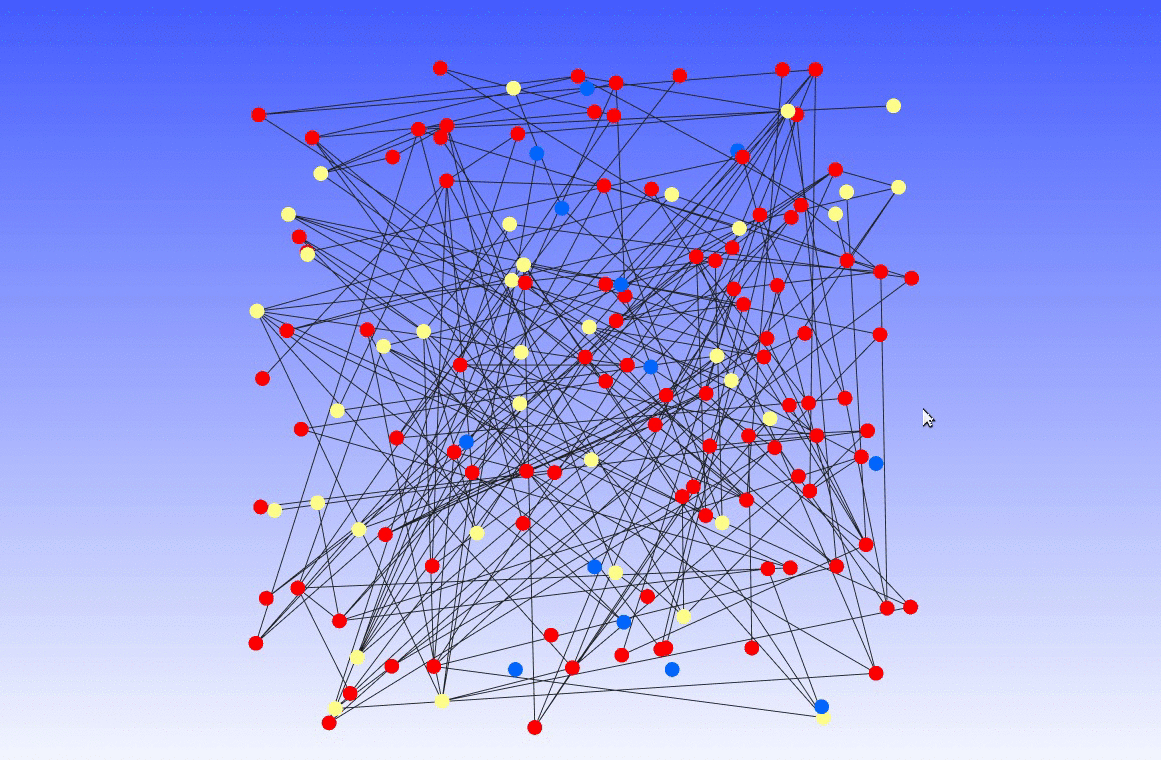
Recently Fei and I started working on a project, tentatively called "system designer" (syd for short), which we hope will provide a foundation for that kind of tooling. syd is currently functional but its features are provisional - I've included some examples of visualizations built on top of it, demoing simple models, although it is capable of more sophisticated agent-based models as well.

From an engineering perspective, the goal is to make it easy to write agent-based simulations which may have massive amounts of computationally demanding agents without having to deal with the messiness of parallel and distributed computing.

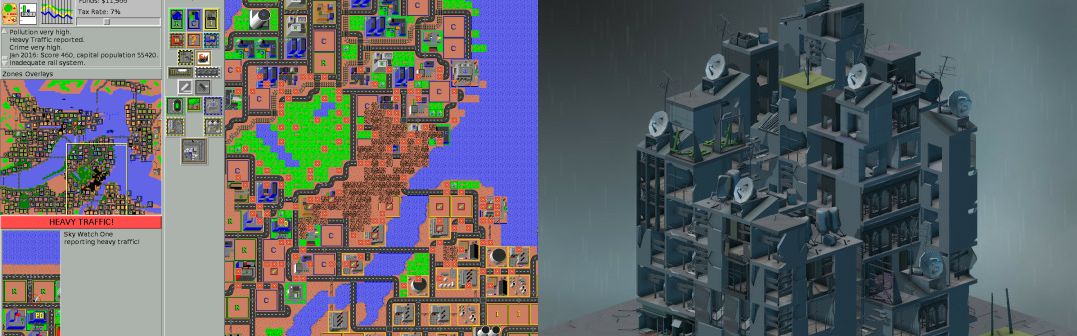
From a design perspective, the goal is to provide interfaces that make defining, running, visualizing, and analyzing such simulations an exploratory experience, almost like a simulation video game (e.g. SimCity).

In both the design and engineering cases there are many interesting challenges.

I'm going to discuss the engineering aspects of the project here and how syd is approaching some of these problems (but bear in mind syd is still in very early stages and may change significantly). At another point I'll follow-up with more about the design and interface aspects (this is something we're still sketching out).

syd is built on top of aiomas which handles lower-level details like inter-node communication, so I won't discuss those here.

(note that at time of writing, not all of what's discussed here has been implemented yet)

3D Schelling model with syd

The demands of simulation

If you're conducting a relatively lightweight simulation, like cellular automata, in which agents are composed of a few simple rules, you can easily run it on a single machine, no problem. The update of a single agent takes almost no time.

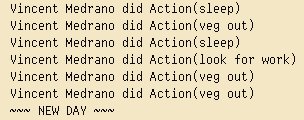
Unfortunately, this approach starts to falter as you get into richer and more detailed simulations. In our first attempts at Humans of Simulated New York, Fei and I designed the agents to be fairly sophisticated - they would have their own preferences and plan out a set of actions for each day, re-planning throughout the day as necessary. Even with our relatively small action space (they could work, look for work, relax, or visit a doctor), this planning process can take quite awhile, especially when it's executed by hundreds or thousands of agents.

Here you could turn to parallel or distributed methods: you'd take your population of agents, send them to a bunch of different threads or processes or computers (generally referred to as "multi-node" architecture), and then update them in parallel. For example, if you run your simulation across two machines instead of just one, you can almost double the speed of your simulation.

Normally to convert a single-node simulation to a multi-node one you'd have to change up your code to support communication across nodes and a laundry list of other things, but syd abstracts away the difference. You simply instantiate a ComputeSubstrate and you pass in either a single host or a list of hosts. If you pass a single host, the simulation runs in the local process; if a list of hosts, syd transparently runs it as a multi-node simulation:

from syd import ComputeSubstrate

single_node = ComputeSubstrate(('localhost', 8888))

multi_node = ComputeSubstrate([
        ('localhost', 8888),
        ('localhost', 8889),
        ('192.168.1.3', 8888),
        ('192.168.1.3', 8889)])

Determining where agents go

That's great, but it doesn't come for free. Consider a simulation in which each agent must consult a few other agents before deciding what to do. For a single-node (here I'm using a "node" to refer to a single serial process) simulation this communication would happen quickly - all agents are in the same process so there's basically no overhead to get data from one another.

As soon as we move to the multi-node case we have to worry about the overhead that network communication introduces. The computers we distribute our population across could be on separate continents, or maybe we just have a terrible internet connection, and there may be considerable lag if an agent on one node needs a piece of data from an agent on another node. This network overhead can totally erase all speed gains we'd get from distributing the simulation.

The typical way of managing this network overhead is to be strategic about how agents are distributed across the nodes. For example, if we're simulating some kind of social network, maybe agents really only communicate with their friends and no one else. In this case, we'd want to put groups of friends in the same process so they don't have to go over the network to communicate, and we'd effectively eliminate most of the network communication.

The problem here (maybe you're starting to see a pattern) is that there is no one distribution strategy that works well for all conceivable agent-based simulations. It really depends on the particular communication patterns that happen within the simulation. In the literature around engineering these agent-based systems you'll see mention of "spheres of influence" and "event horizons" which determine how to divide up a population across nodes. Agents that are outside of each other's spheres of influence or beyond each other's event horizons are fair game to send to different nodes. Unfortunately what exactly constitutes a "sphere of influence" or "event horizon" varies according to the specifics of your simulation.

In syd, if you create a multi-node substrate you can also specify a distribution strategy (a Distributor object) which determines which agents are sent to which nodes. So far there are only two strategies:

  • syd.distributors.RoundRobin: a naive round robin strategy that just distributes agents sequentially across nodes.
  • syd.distributors.Grid2DPartition: if agents live in a grid, this recursively bisects the grid into "neighborhoods" so that each neighborhood gets its own node. This is appropriate when agents only communicate with adjacent agents (e.g. cellular automata). Network communication still happens at the borders of neighborhoods, but overall network communication is minimized.

You can also define your own Distributor for your particular case.

from syd import ComputeSubstrate, distributors

multi_node = ComputeSubstrate([
        ('localhost', 8888),
        ('localhost', 8889),
        ('192.168.1.3', 8888),
        ('192.168.1.3', 8889)],
        distributor=distributors.RoundRobin)

There is yet another problem to consider - in some simulations, agents may be mobile; for example, if we're simulating a grid world, we may distribute agents according to where in the grid they are (e.g. with the Grid2DPartition distributor), but what if they move to another part of the grid? We might want to move them to the node that's running that part of the grid. But if this happens a lot, now we've introduced a ton of overhead shuffling agents from node to node.

As another example - if the topology of the simulation is a social network instead of a grid, such that they are communicating most with their friends, what happens if those relationships change over time? If they become friends with agents on another node, should we re-locate them to that node? Again, this will introduce extra overhead.

I haven't yet come up with a good way of handling this.

Social network SIR model with syd

Race conditions and simultaneous updates

There is yet another problem to consider. With a single-node simulation, agents all update their states serially. There is no fear of race conditions: we don't have to worry about multiple agents trying to simultaneously access a shared resource (e.g. another agent) and making conflicting updates or out-of-sync reads.

This is a huge concern in the multi-node case, and the way syd works around it is to separate agent updates into two distinct phases:

  • the decide phase, a.k.a. the "observation" or "read" phase, where the agent collects ("observes") the information it needs from other agents or the world and then decides on what updates to make (but it does not actually apply the updates).
  • the update phase, a.k.a. the "write" phase, where the agent applies all queued updates.

So in the decide phase, agents queue updates for themselves or for other agents as functions that mutate their state. This has the effect of agents simultaneously updating their states, as opposed to updating them in sequence.

Unfortunately, this structure does not entirely solve our problems - it is possible that there are conflicting or redundant updates queued for an agent, and those usually must be dealt with in particular ways. I'm still figuring out a good way to manage this.

Node failures

Another concern is the possibility of node failure. What if a machine dies in the middle of your simulation? All the agents that were on that machine will be lost, and the simulation will become invalid.

The approach that I'm going to try is to snapshot all agent states every ¦n¦ steps (to some key-value store, ideally with some kind of redundancy in the event that one of those nodes fail!). If a node failure is detected, the simulation supervisor will automatically restart the simulation from the last snapshot (this could involve the spinning up of a new replacement machine or just continuing with one less machine).

Abstract the pain away

Long story short: parallel and distributed computing is hard. Fortunately for the end-user, most of this nasty stuff is hidden away. The plan is to include many "sensible defaults" with syd so that the majority of use-cases do not require, for example, the implementation of a custom Distributor, or any other messing about with the internals. You'll simply indicate that you want your simulation to run on multiple computers, and it'll do just that.

References

  • Antelmi, A., Cordasco, G., Spagnuolo, C. & Vicidomini, L. (2015). On Evaluating Graph Partitioning Algorithms for Distributed Agent Based Models on Networks. European Conference on Parallel Processing.
  • Bharti, R. (2016). HIVE - An Agent Based Modeling Framework. Master's Projects.
  • Chenney, S. (2001). Simulation Level-of-Detail. Game Developers Conference.
  • Chenney, S. Simulation Culling and Level-of-Detail. IEEE Computer Graphics and Applications.
  • Chenney, S., Arikan, O. & Forsyth, D. (2001). Proxy Simulations for Efficient Dynamics. EUROGRAPHICS.
  • Chris Rouly, O. (2014). Midwife: CPU cluster load distribution of Virtual Agent AIs. Complex, Intelligent and Software Intensive Systems (CISIS).
  • He, M., Ruan, H. & Yu, C. (2003). A Predator-Prey Model Based on the Fully Parallel Cellular Automata. International Journal of Modern Physics C.
  • Holcombe, M., Coakley, S., Kiran, M., Chin, S., Greenough, C., Worth, D., Cincotti, S., Raberto, M., Teglio, A., Deissenberg, C., van der Hoog, S., Dawid, H., Gemkow, S., Harting, P. & Neugart, M. (2013). Large-Scale Modeling of Economic Systems. Complex Systems, 22.
  • K. Bansal, A. (2006). Incorporating Fault Tolerance in Distributed Agent Based Systems by Simulating Bio-computing Model of Stress Pathways. Proceedings of SPIE, 6201.
  • K. Som, T. & G. Sargen, R. (2000). Model Structure and Load Balancing in Optimistic Parallel Discrete Event Simulation. Proceedings of the Fourteenth Workshop on Parallel and Distributed Simulation.
  • Kim, I., Tsou, M. & Feng, C. (2015). Design and implementation strategy of a parallel agent-based Schelling model. Computers, Environment and Urban Systems, 49(2015), pp. 30-41.
  • Kubalík, J., Tichý, P., Šindelář, R. & J. Staron, R. (2010). Clustering Methods for Agent Distribution Optimization. IEEE Transactions on Systems, Man, and Cybernetics, Part C (Applications and Reviews).
  • Lees, M., Logan, B., Oguara, T. & Theodoropoulos, G. (2004). Simulating Agent-Based Systems with HLA: The Case of SIM_AGENT - Part II. International Conference on Computational Science.
  • Logan, B. & Theodoropoulos, G. (2001). The Distributed Simulation of Multi-Agent Systems. Proceedings of the IEEE, 89(2).
  • Lysenko, M. & M. D'Souza, R. (2008). A Framework for Megascale Agent Based Model Simulations on Graphics Processing Units. Journal of Artificial Societies and Social Simluation, 11(4/10). http://jasss.soc.survey.ac.uk/11/4/10.html.
  • Márquez, C., César, E. & Sorribes, J. (2015). Graph-Based Automatic Dynamic Load Balancing for HPC Agent-Based Simulations. European Conference on Parallel Processing.
  • Navarro, L., Flacher, F. & Corruble, V. (2011). Dynamic Level of Detail for Large Scale Agent-Based Urban Simulations. Proceedings of 10th International Conference on Autonomous Agents and Multiagent Systems, pp. 701-708.
  • Oey, M., van Splunter, S., Ogston, E., Warnier, M. & M.T. Brazier, F. (2010). A Framework for Developing Agent-Based Distributed Applications. BNAIC 2010: 22rd Benelux Conference on Artificial Intelligence.
  • Pleisch, S. & Schiper, A. (2000). Modeling Fault-Tolerant Mobile Agent Execution as a Sequence of Agreement Problems. Reliable Distributed Systems.
  • Richiardi, M. & Fagiolo, G. (2014). Empirical Validation of Agent-Based Models.
  • Rousset, A., Herrmann, B., Lang, C. & Philippe, L. (2015). A communication schema for parallel and distributed Multi-Agent Systems based on MPI. European Conference on Parallel Processing.
  • Rubio-Campillo, X. (2014). Pandora: A Versatile Agent-Based Modelling Platform for Social Simulation. SIMUL 2014: The Sixth International Conference on Advances in System Simulation.
  • Scheutz, M. & Schermerhorn, P. (2006). Adaptive Algorithms for the Dynamic Distribution and Parallel Execution of Agent-Based Models. Journal of Parallel and Distributed Computing.
  • Sunshine-Hill, B. (2013). Managing Simulation Level-of-Detail with the LOD Trader. Motion in Games.
  • Tsugawa, S., Ohsaki, H. & Imase, M. (2012). Lightweight Distributed Method for Connectvity-Based Clustering Based on Schelling's Model. 26th International Conference on Advanced Information Networking and Applications Workshops.
  • Vecchiola, C., Grosso, A., Passadore, A. & Boccalatte, A. (2009). AgentService: A Framework for Distributed Multi-Agent System DEvelopment. International Journal of Computers and Applications, 31(3), pp. 204-210.
  • Dubitzky, W., Kurowski, K., & Schott, B, eds. (2012). Large-Scale Computing Techniques for Complex System Simulations.

Humans of Simulated New York

04.11.2016

Humans of Simulated New York

For our month-long DBRS Labs residency, Fei and I built the beginnings of a tool set for economy agent-based simulation. My gut feeling is the next phase of this AI renaissance will be around simulation. AlphaGo's recent victory over the Go world champion - a landmark in AI history - resulted from a combination of deep learning and simulation techniques, and we'll see more of this kind of hybrid.

Simulation is important to planning, a common task in AI. Here "planning" refers to any task that requires producing a sequence of actions (a "plan") that leads from a starting state to goal state. An example planning problem might be: I need to get to London (starting state) from New York (goal state), what's the best way of getting there? A good plan for this might be: book a flight to London, take a cab to the airport, get on the flight. But there are infinitely many other plans, depending on how detailed you want to get. I could walk and swim to London - it's not a very good plan, but it's a plan nonetheless!

To produce such plans, there needs to be a way of anticipating the outcome of certain actions. This is where simulation comes in. For example, in deciding how to get to the airport, I have to consider various scenarios - traffic could be bad at this particular hour, maybe there's some chance the cab breaks down, and so on. Simulation is the consideration of these scenarios.

So simulation, especially as it relates to planning, is crucial to AI's more interesting applications, such as policy and economic simulation which seeks to understand the implications of policy decisions. Much like machine learning, planning and simulation have a long history and are already used in many different contexts, from shipping logistics to spacecraft. The residency was a great opportunity to begin exploring this space.

First plan

The general idea was to use a simulation technique called agent-based modeling, in which a system is represented as individual agents - e.g. people - that have predefined behaviors. These agents all interact with one another to produce emergent phenomena - that is, outcomes which cannot be attributed to any individual but rather arise from their aggregate interactions. The whole is greater than the sum of its parts.

Originally we aimed to create a literal simulation of New York City and use it to generate narratives of its agents: simulated citizens ("simulants"). We wanted to produce a simulation heavily drawn from real world data, collating various data sources (census data, market data, employment data, whatever we could scrap together) and unpacking their abstract numbers into simulated lives. Data ostensibly is a compact way of representing very nuanced phenomena - it lossy-compresses a person's life. Using simulation to play out the rich dynamics embedded within the data seemed like a good way to (re-)vivify it. It wouldn't reach the fidelity and honesty of lived experience, but might nevertheless be better than just numbers.

Over time though we became more interested in using simulation to postulate different world dynamics and see how those played out. What would the world look like if people behaved in this way or had these values? What would happen to this group of people if the government instituted this policy? What happens to labor when technology is productive enough to replace them? What if the world had less structural inequality than it does now?

Acknowledgements

This speculative direction had many inspirations:

Past and speculated initiatives around AI and governance were one - in particular, Allende's Cybersyn, the ambitious, way-before-its-time attempt to manage an economy via networked computation under the control of the workers, and the imagined AI-managed civilization of Iain M. Banks' Culture. These reached for utopian societies in which many, if not all, aspects were managed by some form of artificial intelligence, presumably involving simulation to understand the societal impacts of its decisions.

Cybersyn's consoles (via Vanity Fair)

Another big inspiration was speculative social science fiction such as Ursula K. Le Guin's "Hainish Cycle", which explores how differences in fundamental aspects of humans lead to drastically different societies. From these we aspired to create something which similarly carves out a space to hypothesize alternative worlds and social conditions.

Dwarf Fortress (via Ars Technica)

We also referred to what could be called "generative narrative" video games. In these games, no story is fixed or preordained; rather, only the dynamics of the game world are defined. Things take on a life of their own. Bay 12 Games' Dwarf Fortress is one of the best examples of this - a meticulously detailed simulation of a colony of dwarves which almost always ends in tragedy. Dwarf Fortress has inspired other games such as RimWorld, which follows the same general structure but on a remote planet. Beyond the pragmatic applications of economic simulation, the narrative aspect produces characters and a society to be invested in and to empathize with.

In a similar vein, we looked at management simulation games, such as SimCity/Micropolis, Cities: Skylines (by Paradox Interactive, renowned for their extremely detailed sim games), Roller Coaster Tycoon, and more recently, Block'hood, from which we took direction. These games provide a lot of great design cues for making complex simulations easy to play with.

Micropolis & Block'hood

Game of Life

In both a literal and metaphorical way, these simulation games are essentially Conway's Game of Life writ large. The Game of Life is the prototypical example of how a set of simple rules can lead to emergent phenomena of much greater complexity. Its world is divided into a grid, where each cell in the grid is an agent. Each cell has two possible states: on (alive) or off (dead). The rules which govern these agents may be something like:

  • a cell dies if it has only one or no neighbors
  • a cell dies if it is surrounded by four or more neighbors
  • a dead cell becomes alive if it has three neighbors

How the system plays out can vary drastically depending on which cells start alive. Compare the following two - both use the same rules, but with different initial configurations (these gifs are produced from this demo of the Game of Life).

Game of Life: Small Exploder vs Tumbler

This is characteristic of agent-based models: different starting conditions and parameters can lead to fantastically different outcomes.

Interactive and well-designed simulation can also function as an educational tool, especially for something as complex as an economy. The dissociation between our daily experience and the abstract workings of the economy is massive. Trying to think about all its moving parts induces a kind of vertigo, and there is no single position from which the whole can be seen. While our project is not there yet, perhaps it may eventually aid in the cognitive mapping Fredric Jameson calls for in Postmodernism: "a situational representation on the part of the individual subject to that vaster and properly unrepresentable totality which is the ensemble of society's structures as a whole". Bureau d´Études' An Atlas of Agendas attempts this mapping by painstakingly notating nauseatingly sprawling networks of power and influence, but it is still quite abstract, intimidating, and disconnected from our immediate experience.

Bureau d´Études's An Atlas of Agendas

Nick Srnicek calls for something similar in Accelerationism - Epistemic, Economic, Political (from Speculative Aesthetics):

So this is one thing that can help out in the current conjuncture: economic models which adopt the programme of epistemic accelerationism, which reduce the complexity of the world into aesthetic representations, which offer pragmatic purchase on manipulating the world, and which are all oriented toward the political accelerationist goals of building and expanding rational freedom. These can provide both navigational tools for the current world, and representational tools for a future world.

Yet another similar concept is "cyberlearning", described in Optimists’ Creed: Brave New Cyberlearning, Evolving Utopias (Circa 2041) (Winslow Burleson & Armanda Lewis) as:

Today’s cyberlearning–the tight coupling of cyber-technology with learning experiences offering deeply integrated and personally attentive artificial intelligence–is critical to addressing these global, seemingly intractable, challenges. Cyberlearning provides us (1) access to information and (2) the capacity to experience this information’s implications in diverse and visceral ways. It helps us understand, communicate, and engage productively with multiple perspectives, promoting inclusivity, collaborative decision-making, domain and transdisciplinary expertise, self actualization, creativity, and innovation (Burleson 2005) that has transformative societal impact.

We found some encouragement for this approach in Modeling Complex Systems for Public Policies, which was published last year and covers the current state of economic and public policy modeling. In the preface, Scott E. Page writes:

...whether we focus our lens on the forests or students of Brazil or the world writ large, we cannot help but see the inherent complexity. We see diverse, purposeful connecting people constructing lives, interacting with institutions, and responding to rules, constraints, and incentives created by policies. These activities occur within complex systems and when the activities aggregate they produce feedbacks and create emergent patterns and functionalities. By definition, complex systems are difficult to describe, explain, and predict, so we cannot expect ideal policies. But we can hope to improve, to do better. (p. 14)

Early attempts

We had a lot of anxiety in the deciding on the simulation's level of detail. There were a few constraints which prevent us from going too crazy, e.g. computational feasibility (whether or not we can run the simulation in a reasonable amount of time) and sensitivity/precision issues (i.e. all the problems of modeling chaotic systems). These practical concerns were offset by a desire to represent all the facets of life we were interested in, which was too ambitious. This main tension is best described by Borges' On Exactitude in Science, where a map is so detailed that it directly overlays the terrain it is meant to represent. A large part of modeling's value is that it does not seek a one-to-one representation of its referent, generally because it is not only impractical but because the point of a model is to capture the essence of a system without too much noisy detail. For us, the details were important, but we also avoided too literal a model to leave some space for the simulation to surprise us.

Planning agents

First we tried fairly sophisticated simulants, which each had their own set of utility functions. These utility functions determined, for instance, how important money was to them or how much stress bothered them. Some agents valued material wealth over mental health and were willing to work longer hours, while others valued relaxation.

We went way too granular here. Agents would make a plan for their day, hour-by-hour, involving actions such as relaxing, looking for work, seeing friends, going to work, sleeping, visiting the doctor, and so on. Agents used A* search (a powerful search algorithm) to generate a plan they believed would maximize their utility, then executed on that plan. Some actions might be impossible from their current state - for instance, they might be sick and want to visit the doctor, but not have enough money - but agents could set these desired actions as long-term goals and work towards them.

To facilitate developing these kinds of goal-oriented agents, we built the cess framework. Because there is a lot of computation happening here, cess includes support for running a simulation across a cluster. However, even with the distributed computation, modeling agents at this level of detail was too slow for our purposes (we wanted something snappy and interactive), so we abandoned this approach (development of cess will continue separately).

A simple economy

Given that our residency was for only a month, we ended up going with something simple: a conventional agent-based model of a very basic economy, with flexibility in defining the world's parameters. A lot of what we wanted to include had to be left out. A good deal of the final simulation was based on previous work (of which there is plenty) in economic modeling. In particular:

In addition to our simulants (the people), we also had firms, which included consumer good firms, capital equipment firms, raw material firms, and hospitals, and the government. The firms use Q-learning, as described in "An agent-based model of a minimal economy", to make production and pricing decisions. Q-learning is a reinforcement learning technique where the agent is "rewarded" for taking certain actions and "punished" for taking others, so that they eventually know how to act under certain conditions. Here firms use this to learn when producing more or less is a good idea and what profit margins consumers will tolerate.

We still wanted to start from something resembling our world, at least to make the very tenuous claim that our simulation actually proves anything a tiny bit less tenuous. We gathered individual-level American Community Survey data from IPUMS USA and used that to generate "plausible" simulated New Yorkers. At first we tried trendy generative neural net methods like generative adversarial networks and variational autoencoders, but we weren't able to generate very believable simulants that way. In the end we just learned a Bayes net over the data (I hope this project's lack of neural nets doesn't detract from its appeal 😊), which turned out pretty well.

A Bayes net allows us to generate new data that reflects real-world correlations, so we can do things like: given a Chinese, middle-aged New Yorker, what neighborhood are they likely to live in, and what is their estimated income? The result we get back won't be "real" as in the data isn't connected to a real person, but it will reflect the patterns in the original data. That is to say, it could be a real person.

The code we use to generate simulants is available here. This is basically what it does:

>>> from people import generate
>>> year = 2005
>>> generate(year)
{
    'age': 36,
    'education': <Education.grade_12: 6>,
    'employed': <Employed.non_labor: 3>,
    'wage_income': 3236,
    'wage_income_bracket': '(1000, 5000]',
    'industry': 'Independent artists, performing arts, spectator sports, and related industries',
    'industry_code': 8560,
    'neighborhood': 'Greenwich Village',
    'occupation': 'Designer',
    'occupation_code': 2630,
    'puma': 3810,
    'race': <Race.white: 1>,
    'rent': 1155.6864868468731,
    'sex': <Sex.female: 2>,
    'year': 2005
}

This is how we spawned our population of simulants. Because we were also interested in social networks, simulants could become friends with one another. We ripped out the parameters from the logistic regression model (the "confidant model" in the graphic below) described in Social Distance in the United States: Sex, Race, Religion, Age, and Education Homophily among Confidants, 1985 to 2004 (Jeffrey A. Smith, Miller McPherson, Lynn Smith-Lovin, University of Nebraska - Lincoln, 2014) and used that to build out the social graph. This social network determined how illnesses and job opportunities spread.

The graphic below goes into the simulation design in more detail:

An overview of the simulation design

We designed the dynamics of the world so it could model some of the questions posed earlier. For instance, we modeled production and productive technology to explore the idea of automation. Say it takes 10 labor to produce a good, each worker produces 20 labor, and equipment adds an additional 10 labor. Now say your firm wants to produce 10 goods, which requires 100 labor. If you have no equipment, you would need five workers (5*20=100). However, if you have equipment for each worker, you only need four workers (4*(20+10)=120). (In our simulation, each piece of equipment requires one worker to operate it, so you can't just buy 10 pieces of equipment and not hire anyone). To model a more advanced level of automation, we could instead say that each piece of equipment now produces 100 labor, and now to meet that product quota, we only need one worker (1*(20+100)=120). Then we just hit play and see what happens to the world.

An early version of the city

Steering the city

As Ava Kofman points out in "Les Simerables", these kinds of simulations embed their creators' assumptions about how the world does or should work. Discussing the dynamics of SimCity, she notes:

To succeed even within the game’s fairly broad definition of success (building a habitable city), you must enact certain government policies. An increase in the number of police stations, for instance, always correlates to a decrease in criminal activity; the game’s code directly relates crime to land value, population density, and police stations. Adding police stations isn’t optional, it’s the law.

Or take the game’s position on taxes: “Keep taxes too high for too long, and the residents may leave your town in droves. Additionally, high-wealth Sims are more averse to high taxes than low- and medium-wealth Sims.”

The player’s exploration of utopian possibility is limited by these parameters. The imagination extolled by Wright is only called on to rearrange familiar elements: massive buildings, suburban quietude, killer traffic. You start each city with a blank slate of fresh green land, yet you must industrialize.

The landscape is only good for extracting resources, or for being packaged into a park to plop down so as to increase the value of the surrounding real estate. Certain questions are raised (How much can I tax wealthy residents without them moving out?) while others (Could I expropriate their wealth entirely?) are left unexamined.

These assumptions seem inevitable - something has to glue together the interesting parts - but they can be designed to be transparent and mutable. Unlike the assumptions with which we operate daily, these assumptions must be made explicit through code. Keeping all of this in mind, we wanted to make the simulation interactive in such a way that you can alter the fundamental parameters which govern the economy's dynamics. But, while you can tweak numbers of the system, you can't yet change the rules themselves. That's something we'd like to add down the line.

An early idea for player interaction

We played around with a few ideas for making the simulation interactive. At first we thought to have individuals create their own characters, specifying attributes such as altruism and frugality. Then we would run the player's simulant through a year of their life and generate a short narrative about what happened. How the simulant behaves is dependent on the attributes the player input, as well as data-derived environmental factors. One of our goals was to model structural inequality and oppression, so depending on who you are, you may be, for instance, more or less likely to be hired.

World building was a very important component to us. By keeping all player-created individuals as part of the population for future players, the world is gradually shaped to reflect the values of all the people who have interacted with it. (Unfortunately we didn't have time to implement this yet.)

We didn't quite go that route in the end. Because we'll demo the simulation to an audience, we wanted to design for that format - simultaneous participation. In the latest version, players propose and vote on new legislation between each simulated month and try to produce the best outcome (in terms of quality of life) for themselves and/or everyone.

We found in Modeling Complex Systems for Public Policies that this approach is called "participative simulation":

Participative simulation

Visualizing disparity

The simulants in the city are meant to visualize structural inequality, as derived from American Community Survey and New York unemployment data (a full list of data sources is available in the project's GitHub repo). We borrowed from Flatland's hierarchy of shapes and made it so that polygon count correlates with economic status. So in our world, pyramids are unemployed, cubes are employed, and spheres are business owners. The simulant shapes are then colored according to Census race categories. It becomes pretty clear that certain colors have more spheres than others.

Differentiating simulants by shape and color

The city's buildings also convey some information - each rectangular slice represents a different business, and each color corresponds to a different industry (raw material firms, consumer good firms, capital equipment firms, and hospitals). The shifting colors and height of the city becomes an indicator of economic health and priority - as sickness spreads, hospitals spring up accordingly.

Changing tenants in a building

For other indices, we fall back to basic line charts. An important one is the quality of life chart, which gives a general indication about how content the citizens are. Quality of life is computed using food satisfaction (if they can buy as much food - the consumer good in our economy - as they need) and health.

In many scenarios, the city collapses under inflation and gradually slouches into destitution. One by one its simulants blink out of existence. It's really hard to strike the balance for a prosperous city. And the way the economy organized - market-based, with the sole guiding principle of expanding firm profits - is not necessarily conducive to that kind of success.

Mere speculation

Players can choose from a few baked-in scenarios along the axes of food, technology, and disease:

  • food
    • a bioengineered super-nutritional food is available
    • "regular" food is available
    • a blight leaves only poorly nutritional food
  • technology
    • hyper-productive equipment is available
    • "regular" technology is available
    • a massive solar flare from the sun disables all electronic equipment
  • disease
    • disease has been totally eliminated
    • "regular" disease
    • an extremely infectious and severe disease lurks

A post-scarcity society is one option

So people can see how things play out in a vaguely utopian, dystopian, or "neutral" (closer to our world) setting. Sometimes these scenarios play out as you'd expect - the infectious disease scenario wipes out the population in a month or two - but not always. Hyper-productive equipment, for instance, can lead to misery, unless other parameters (such as government) are collectively adjusted by players.

Where could this go?

These simulations are promising in domains like public policy - with movements like "smart cities", it seems inevitable that this application will become ubiquitous - but their potential is soured by the reality of how policy and technological decisions are made in practice. Technological products tend to reproduce the power dynamics that produced them. As alluded to in Eden Medina's piece, Cybersyn could have easily been implemented as a top-down control system instead of something which the workers actively participated in and took some degree of ownership over.

So it could go either way, really.

To me the value of these simulations is as a means to speculate about what the world could be like, to see how much better (or worse) things might be given a few changes in our behavior or our relationships or our environment. We seem to be reaching a high-water mark of stories about dystopia (present and future), and it has been harder for me to remember that "another world is possible". Our project is not yet radical enough in the societies it can postulate, but we hope that these simulations can serve as a reminder that things could be different and provide a compelling vision of a better world to work towards.


A big thank you to Amelia Winger-Bearskin and the rest of the DBRS Labs folks for their support and to Jeff Tarakajian for answering our questions about the Census!


Pablo

07.20.2015

The Avalanches' Since I Left You

My favorite album of all time is The Avalanches' Since I Left You. It's a masterpiece of "plunderphonics", which essentially means "sound collage"; that is, constructing songs purely out of broadly sourced samples. Since the album came out 15 years ago (!!), there has been promise of a second release. This release has yet to materialize.

In this endless interim I wrote Pablo (named after Pablo's Cruise, which is a song on Since I Left You and was the album's original title), a program for automatically generating plunderphonic music. It's output is certainly nothing of Avalanches' caliber, but it's meant more for rapidly sketching ideas than for generating fully-fleshed tracks.

The GitHub repo for Pablo has instructions for installation. Here I'll talk a bit more about how it works.

Selecting and preprocessing the songs

Song selection

The approach is pretty simple - you direct Pablo to a directory of music (mp3s or wavs) and it will start analyzing the tracks, approximating their BPMs and keys for later reference. Almost all of Pablo's audio analysis capabilites rely directly on the Essentia library.

Pablo then randomly picks a "focal" song - the song the rest of the mix is based off of. Pablo goes through the other songs available in the directory and randomly chooses a few that are within a reasonable distance from the focal song in both key and BPM (to avoid ridiculous warping, although maybe you want that to happen).

These other songs are pitch-shifted and time-stretched to conform to the focal song. Then, in each track, beat onset detection happens to identify downbeats. These downbeats are used to slice the tracks into samples of different sizes (the sizes must be a power of 2, e.g. 4, 8, 16, 32, etc). By default these samples are 16 beats and 32-beats.

A challenge here was beatmatching. For the most part, Pablo does pretty well at identifying proper beat onsets. But some samples become irregular - if there is an instrumental bridge, for instance, or a long intro, then Pablo may not cut that part into properly-sized samples. So there is an additional step where Pablo finds the mode sample duration (in milliseconds) and discards all samples not of this length. That way we have greater assurance that when the samples are finally assembled into tracks, they will align properly (since all samples of the same beat length will have the exact same time duration).

Assembling the mix

With all the samples preprocessed, Pablo can begin putting the tracks together. To do so, Pablo just places samples one after the another using the stochastic process outlined below.

A song length is specified in beats, which also must be a power of 2. For instance, we may want a song that is 64-beats long. Pablo then recursively goes down by powers of 2 and tries to "fill in" these beats.

For example, say we want a 64-beat long song and we have a samples of size 32, 16, and 8. Pablo first checks to see if a 64-beat sample is available. One isn't, so then it knows it needs two 32-beat samples (i.e. we have two 32-beat slots to fill). A 32-beat sample is available, so for each 32-beat slot Pablo randomly decides whether or not to use a complete 32-beat sample or to further split that slot into two 16-beat slots. If Pablo chooses the latter, the same process is again applied until the smallest sample size is reached. So in this example, Pablo would stop at two 8-beat slots since it does not have any samples smaller than 8 beats.

Selecting samples

Pablo also has some heuristics to ensure a degree of coherence in the tracks it creates. Without this, Pablo's tracks would be too spastic, with sudden cutoffs and changes in samples every bar. So to decide what sample should follow the current sample, Pablo uses a simple Markov chain model which favors staying in the same song and favors repeating the same sample.

Markov Chain Coherence

Each track is constructed in this way. Pablo creates (by default) two tracks which are then overlaid to form the final mix. However, sometimes samples from the same song are overlaid each other, which isn't quite what I wanted, so one final heuristic is implemented. When constructing tracks after the first, Pablo will try its best to avoid placing samples from the same song over each other. Sometimes this is unavoidable, such as when there are more tracks being made than there are songs. But for the most part it works out.

That's really about it in terms of generating the songs. I've also been playing a bit with vocal detection, since hearing multiple people singing can be disorienting, and I would like to add in some genre-identification features as well.

The Infinite Playlist

One final feature is the "crate digging" feature, in which Pablo takes a seed YouTube url and crawls its related videos, quickly amassing some songs to sample. Eventually I'd like it so that Pablo can become the infinite playlist, crawling YouTube (and perhaps SoundCloud and other sources) and endlessly mixing songs into each other.

An example song

Here's a song that Pablo produced:

It's a bit hectic, but for the most part beats match well and there are some interesting moments in there. Pablo outputs sample listings with times, along with the original samples, so it's easy to recreate the parts that you like.

Source

You can check out how all this is implemented in the GitHub repo, along with installation instructions to run Pablo yourself!


Port

06.30.2015

I've had a lot of trouble finding a blogging platform which I enjoyed using - they were either too heavy or required using a web editor or were tricky to customize and theme. So last week I put together a super lightweight blogging platform called port.

port is the centralized complement to nomadic, which is a lightweight note management system. Like nomadic, port uses directory structure to define its routing structure and works primarily off markdown documents.

Here's what port offers:

  • Posts are GitHub-flavored markdown files, with MathJax support
  • A blog is represented as a directory, with subdirectories of markdown posts
  • Post categories are defined by the folders they are in
  • RSS feeds for individual categories and for all posts
  • Very easy theming (Jinja2 templates)
  • Managed via a CLI (the port command)
  • No database necessary!
  • No admin UI necessary!

There are a couple additional convenience features as well:

  • port sync makes it easy to sync your local site files to a remote machine (e.g. your server)
  • port host generates the config files necessary to host your blog with uwsgi, supervisor, and nginx
  • port serve serves the site locally, which is useful for previewing your work

Tutorial

Here's how to get going with port. For this example I'll specify my site's directory as ~/spaceandtimes.

Install

pip install port

Create a site (I'll use my site as an example) and go through the config

port create spaceandtimes

Setup a category (just renaming the default category port creates)

mv ~/spaceandtimes/default_category ~/spaceandtimes/coding

Add an image to the assets folder

mv ~/some_image.png ~/spaceandtimes/assets/

Create a post (using vi here but use whatever editor you'd like)

vi ~/spaceandtimes/coding/my_first_post.md

---
published_at: 06.30.2015 10:53
---

Hello!

Here's an image:
![some alt text](/assets/some_image.png)

Build the site

port build spaceandtimes

Serve the site locally

port serve spaceandtimes

Check it out at localhost:5005!

To host the site on a server, follow these steps (this assumes an Ubuntu server):

Install the right stuff

sudo apt-get update
sudo apt-get install uwsgi supervisor uwsgi-plugin-python uwsgi-plugin-python3 nginx

Install port on the server

pip install port

Create the site on the server (again, say we put the site at ~/spaceandtimes):

port create spaceandtimes

Then run the host command to automatically generate the necessary configs and restart the nginx and supervisor processes (the last argument is the user that the site was generated under):

port host spaceandtimes blog.spaceandtimes.com ftseng

From your local machine, sync your site (but first, build your site locally):

port sync spaceandtimes user@my_server.com:~/spaceandtimes

Workflow

My workflow with port is to write posts locally, build locally, and then sync to my server. It's super fast and easy :)

So basically:

vi ~/spaceandtimes/etc/my_new_post.md
port build spaceandtimes
port sync spaceandtimes ftseng@myserver.com:~/spaceandtimes

And that's it!

See the GitHub repo for more info on theming and other details.


Clustering news articles with hs_cluster

06.18.2015

This week I returned to tackling the news clustering problem I had been exploring last year.

The general goal is to take in groups of news articles, and cluster them so that news articles talking about the same event are grouped together.

Before, I used a clustering technique that was an incremental form of hierarchical agglomerative clustering (IHAC, implementation available here) which seemed better suited for the task compared to more popular approaches like k-means and DBSCAN. However, that technique had its own problems.

The problem

The clustering quality still was not where I needed it to be - in particular, many of the resulting article clusters (which I call "events") included articles which were unrelated to the others.

This is a problem of cluster homogeneity, which asks: how many members are in clusters with members from other true clusters? The complement of this is completeness, which asks: how many members that belong together (in the true clustering) were clustered together? Lower completeness is tolerable - people are less likely to notice the absence of an article that belongs than the presence of an article that doesn't (which is what homogeneity measures).

As a simple illustration, imagine the true clusters:

$$
[A_1, A_2, A_3], [B_1, B_2, B_3]
$$

The following clustering has a homogeneity score of 1 (the best score) and a completeness score of ¦\approx 0.685¦.

$$
[A_1, A_2], [A_3], [B_1, B_2, B_3]
$$

The following clustering has a completeness score of 1 (the best score) and a homogeneity score of ¦\approx 0¦.

$$
[A_1, A_2, A_3, B_1, B_2, B_3]
$$

For my task, the former is preferable to the latter.

Note that the following clustering has a homogeneity score of 1, but a completeness score of ¦\approx 0.387¦.

$$
[A_1], [A_2], [A_3], [B_1], [B_2], [B_3]
$$

We don't want to achieve good homogeneity at the total expense of completeness, as is the case here!

Parameter selection

The severity of this problem was mostly affected by where I decided to snip the cluster hierarchy that IHAC produced. The problem is that this value is difficult to determine in advance as it may vary for different sets of articles.

This dilemma - known as parameter selection - is one that crops up a lot in clustering. For k-means, it's the question of the value for ¦k¦; for DBSCAN, it's the value of ¦\epsilon¦ under concern.

For IHAC my selection heuristic was based on the average density of branch nodes, but that was not working well.

In the case of k-means and DBSCAN, this problem of parameter selection is an area of active research, so there are a few promising techniques to start with.

DBSCAN parameter selection

For DBSCAN, one technique (outlined here) involves looking at the nearest neighbor for each point and identifying some majority value for ¦\epsilon¦ based on that.

The technique I'm using is similar - it involves taking the ¦n¦ nearest neighbors for each point, looking at the distances between them, and identifying the largest "jump" in distance. The average of the distances that precede those jumps in difference is used as ¦\epsilon¦.

(Though I also wonder if ¦\epsilon¦ is a parameter that could be learned; that is, if news events tend to have a similar article density.)

k-means parameter selection

For k-means, one effective approach is outlined here, called "¦f(K)¦", which runs k-means iteratively with different values of ¦k¦ and computes scores for them (see the article for details).

You do need to specify an upper limit for ¦k¦, which in theory could just be ¦n¦ (the number of documents), but practically speaking, this can be very slow and it's unlikely that every document will belong to its own cluster. I've been using ¦n//3 + 1¦ under the assumption that the events have at least 3 news articles each.

For k-means, getting ¦k¦ right is especially important. DBSCAN has a concept of outliers so points which don't seem to belong to clusters will be treated as noise. But for k-means, every point must be assigned to a cluster, which can be problematic.

Evaluating these approaches

To evaluate these approaches, I needed some ground truth events. Fortunately, there is a resource for this: Wikinews.

On Wikinews, contributors write entries about news events and supply a list of sources for each. XML dumps of these pages are available - so I put together a program called focusgroup which parses these dumps, applies a few heuristics to weed out noise events - those in other languages, with too few sources, with sources which are no longer available, with unreliable sources, etc. - and then downloads and extracts the source pages' main content into a database.

Evaluation datasets of 10, 20, and 30 randomly selected clusters/events were built from this data.

What follows are the scores for k-means with automated parameter selection, DBSCAN with automated parameter selection, and my hs_cluster approach (which I'll explain below) on the 10, 20, and 30 event datasets (which I'll call 10E, 20E, and 30E, respectively).

For k-means and DBSCAN, documents are represented using TF-IDF weighted vectors (see the vectorizer source for details).

(Note that k-means is not included for the 30 event dataset because automated parameter selection seemed to run indefinitely.)

Approach # Clusters Completeness Homogeneity Time
10E kmeans_cluster 7 0.9335443486 0.7530130785 6.65s
dbscan_cluster 6 1.0 0.7485938828 0.34s
hs_cluster 12 0.9287775491 0.9527683893 2.79s
20E kmeans_cluster 16 0.9684967878 0.8743004102 12.08s
dbscan_cluster 16 0.9580321015 0.8637897487 0.52s
hs_cluster 35 0.8677638864 0.9888333740 4.42s
30E kmeans_cluster n/a n/a n/a n/a
dbscan_cluster 7 0.9306925670 0.2568053596 7.13s
hs_cluster 60 0.8510288789 0.9539905161 11.27s

None of the approaches reliably get close to the number of true clusters. But what's important is that the hs_cluster approach scores much better on homogeneity (at the expense of completeness, but again, that's ok).

The hs_cluster approach

These automatic approaches are okay at finding decent values for these parameters, since these scores are not terrible - but they are clearly still weak on the homogeneity front.

An approach that doesn't require specification of a parameter like ¦k¦ or ¦\epsilon¦ would be ideal.

I've developed an approach which I call hs_cluster (the reason for the name is left as an exercise for the reader) which has been effective so far. Like all approaches it needs some concept of document similarity (or distance, as is the case with k-means and DBSCAN)

Document similarity

First, the pairwise similarity between all documents is computed.

Here I'm trying to take advantage of some features of the news - in particular, the assumption that articles that belong to the same event will typically talk about the same named entities.

The simplest similarity computation for a pair of documents is just the size of entity intersection (I'll go into some improvements on this further on).

Detecting outliers

Given these pairwise similarities, how do we know when two documents are significantly similar? This could be framed as a new parameter - i.e. some threshold entity intersection, above which we can say two documents are sufficiently alike.

However, this just introduces a new parameter selection problem, when the whole point of this new approach is to avoid doing exactly that!

Instead, statistical outliers seem promising. For a each document, we identify which of its similarities with other documents is an upper outlier, and consider those significant.

There are a few techniques for detecting outliers.

Perhaps the simplest involves using quartiles of the data: look at values above ¦Q_3 + 2(Q_3 - Q_1)¦. The main problem with this technique is that it's sensitive to the sample size, e.g. if you are looking at a handful of documents, you're unlikely to get reliable results.

Another technique is similar to the ¦\epsilon¦ selection for DBSCAN, where abnormally large jumps between values are identified, and outliers are considered values above that jump.

A third technique is based on median-absolute-deviation (MAD), outlined here. This technique has the benefit of not being sensitive to sample size.

In practice, the simple quartile approach has worked best. I haven't looked at document sets of less than 10 in size, so perhaps below that it falls apart.

Creating the graph

These documents and their outlier similarities were then used to construct a graph where these outlier similarities define edges and their weights between documents.

Identifying and disambiguating cliques

Once the graph is formed, it's just a matter of running a clique finding algorithm (the networkx library includes one) on it.

There is one last issue - an article may belong to multiple cliques, so we need to disambiguate them. The method is simple: stay in the clique for which membership is the strongest (as quantified by the sum of edge weights) and leave all the others.

Initial results

The initial results of this approach were promising:

Completeness Homogeneity
10E 0.9287775491 0.9527683893
20E 0.8347274166 0.9724715221
30E 0.8491559191 0.9624775352

And here is the graph for the 10E dataset (all graphs are shown before clique disambiguation):

10E hs_cluster graph

(Node labels are in the format of {cluster id}_{article id}.)

It looks pretty good - some of the true clusters are isolated cliques. But there are still many connections between unrelated articles, so it seems that there's room for improvement.

Weighting intersections

"Global" IDF

Up until now we were only looking at intersection of entities, so all entities are treated equally. However, there are some fairly uninformative entities, like "US" or "Congress" which we expect to see naturally occur in many articles. We want to down-weight these entities since their appearance across two documents is unremarkable. Conversely, we want to up-weight entities which rarely occur, since their presence in an intersection is unlikely and therefore more meaningful.

Normally the approach here would be to incorporate IDF (inverse document frequency) weighting; typically this IDF is calculated from the input documents. However, the corpora I'm working with now (and expect to use in the future) are fairly small, perhaps 30-100 documents at a time, which limits the possibility of any meaningful IDF being generated. Instead I've opted for an IDF model built on an external source of knowledge - about 113,200 New York Times articles. That way we have some "global" understanding of a term's importance in the context of news articles.

So now instead of merely looking at the size of the intersection, it uses the sum of the IDF weights of the intersection's members.

Inverse length weighting

The possible intersection between two documents is affected by the length of the documents, so the IDF-weighted overlaps are then further weighted by the inverse of the average length of the two documents being compared.

Results of weighting

Incorporating these weights seem to help for the most part:

Completeness Homogeneity
10E 0.9557853457 1.0
20E 0.8375545102 0.9793536415
30E 0.8548535867 0.9689355683

Here is the resulting graph for 10E:

10E hs_cluster graph

It looks a lot cleaner than before!

Incorporating keywords

A grim observation from the data is that entities may not be enough to fully discern different news events, such as these two events in the 10E dataset:

[2] US soldier arrested for rape and four murders in Iraq
[5] Two Iraqi MPs killed in bombing at parliament

And these two events in the 20E dataset:

[3] Al Jazeera airs new Osama Bin Laden tape
[5] Bin Laden's former driver convicted of supporting terrorism

(Event names are taken from their Wikinews page title)

It seemed that looking at keywords might provide the missing information to disambiguate these events. So for each article I applied a few keyword extraction algorithms followed by the same approach that was used for entities: use the length-weighted sum of the IDF-weighted keyword intersections.

The final similarity score is then just the sum of this keyword score and the entity score from before.

The results for 10E are actually hurt a bit by this, but improved slightly for 20E and 30E:

Completeness Homogeneity
10E 0.9051290086 0.9527683893
20E 0.8574072716 0.9888333740
30E 0.8414058524 0.9704378548

If we look at the graph for 10E, it's clear why the results were worse:

10E hs_cluster graph

More noise (i.e. unwanted edges) have been introduced, as you might expect.

For now, I've left the keyword intersection in, but it may require some additional processing to eliminate noisy terms.

Next steps

hs_cluster can overshoot the true number of events by quite a bit, but this is because it is still very conservative in how it connects articles together for now. Finding so many extra clusters (i.e. lower completeness) indicates missing edges (this is clear in the graph for the 20E dataset, below), so edge formation needs more investigation: is it a problem of outlier detection? Is it a problem of computing document similarity?

20E hs_cluster graph

It's also unclear how hs_cluster will perform on larger document sets. The 30E dataset includes 103 documents and takes 11-12 seconds. This grows exponentially with the graph size. I have not looked deeply into clique-finding algorithms, but a quick look shows that the Bron-Kerbosch algorithm is an efficient way of identifying cliques.

Overall, the results are encouraging. There's still room for improvement, but it seems like a promising direction.

Source

Source code for the project is available at https://github.com/frnsys/hscluster. The IDF models are not included there; if you are interested, please get in touch - I'm on Twitter as @frnsys.

<< >>