Finding closest edge positions in a spatial network
I encountered an interesting challenge the other day while working on a transit demand model for the PolicySpace project (under Bernardo Furtado at the IPEA/Institute of Applied Economic Research).
We have bus data for Belo Horizonte, one of the largest cities in Brazil (and South America). Specifically, we have GTFS (General Transit Feed Specification) data with geographic coordinates of bus stops.
We also have a network of the city’s roads, with data provided by OpenStreetMaps and accessed with the osmnx library. The library provides us with the geographic and UTM (Universal Transverse Mercator) projected coordinates for nodes as well as line geometries for most of the edges (edges which are just straight lines don’t have geometries provided, but they can be inferred from the coordinates of their start and end nodes).
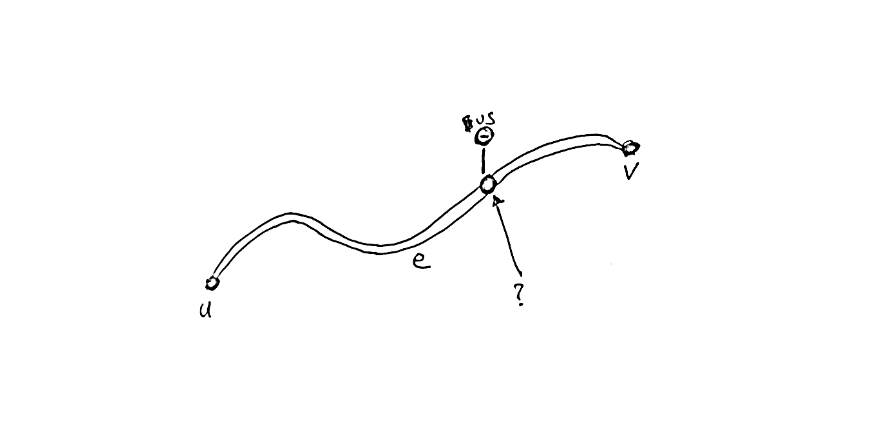
How do we meaningfully map these bus stops to our road network? The first instinct might be to associate them with their closest node, but many bus stops start somewhere along a road rather than at the start or end of one.
So we need to be able to find the closest point along a road for a given bus stop. This is trickier because whereas nodes can be treated as single points, roads potentially have winding geometries. A road which starts and ends far from a bus stop might nevertheless have a very close point to the bus stop somewhere along it. We want to accommodate these kinds of cases.
The first step is to find candidate edges that are close enough to the bus stop to be plausible roads for it. We have bounding boxes for each edge’s geometry, so we can accomplish this search with a quadtree, using Pyqtree. A quadtree is a data structure that indexes 2D boxes and allows you to quickly find boxes which overlap a given query box. It’s sort of like a kd-tree but can search boxes in addition to points.
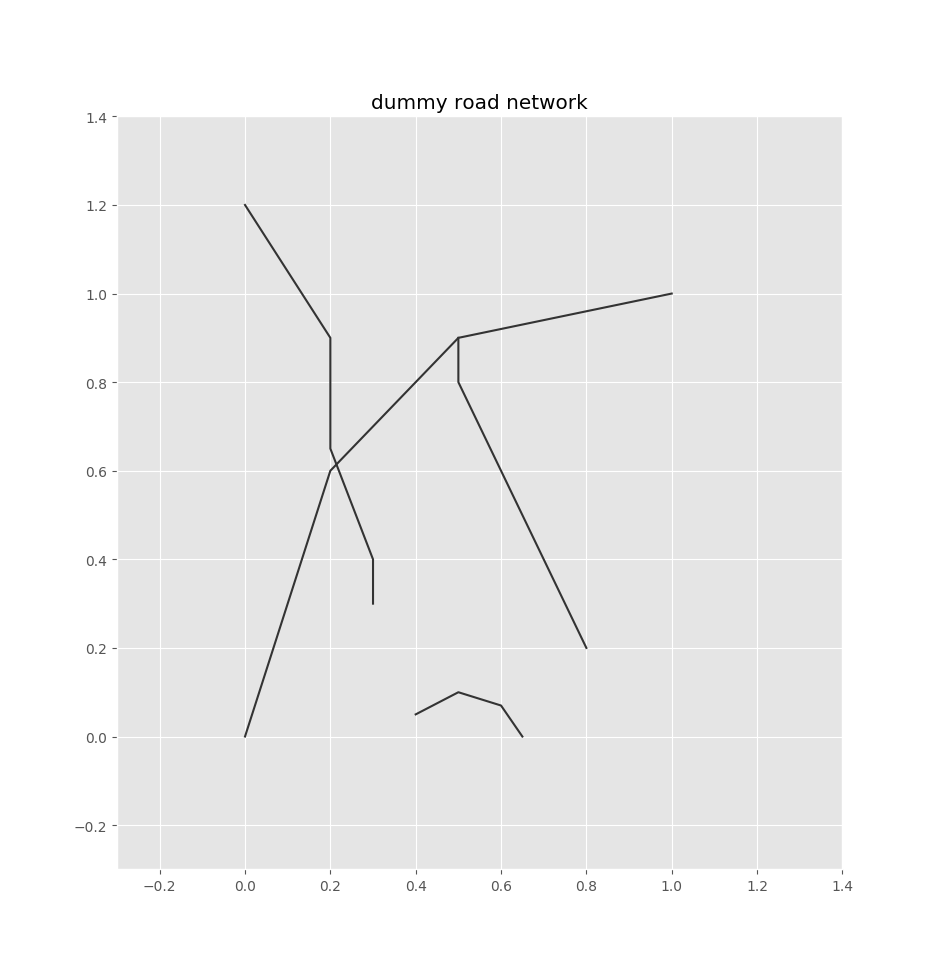
To demonstrate this process, I’ll use a dummy road network consisting of a few paths:
bbox = (-0.3, -0.3, 1.4, 1.4)
paths = [
    [(0, 0), (0.2, 0.6), (0.5, 0.9), (1, 1)],
    [(0.8, 0.2), (0.5, 0.8), (0.5, 0.9)],
    [(0.4, 0.05), (0.5, 0.1), (0.6, 0.07), (0.65, 0)],
    [(0, 1.2), (0.2, 0.9), (0.2, 0.65), (0.3, 0.4), (0.3, 0.3)],
]
Which looks like:
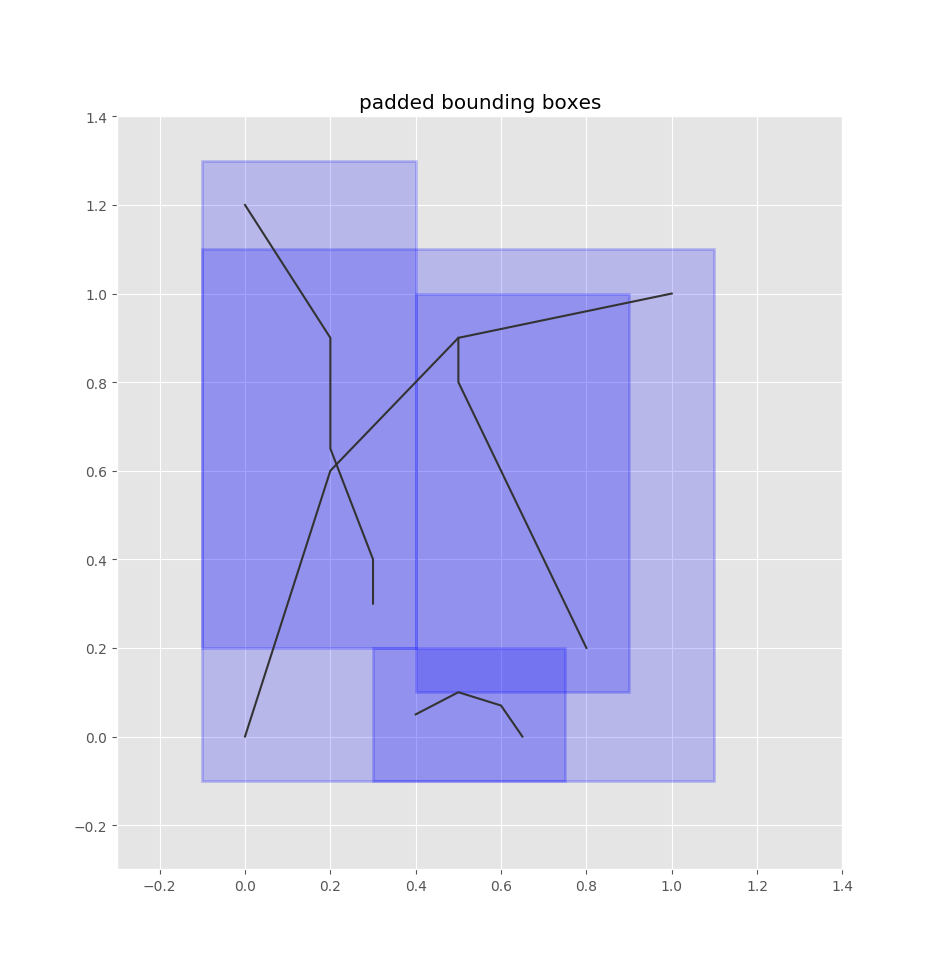
So we index all our edges’ bounding boxes into this quadtree. We pad the bounding boxes by some configurable radius, since the bus stop is likely to be in the vicinity of an edge’s borders.
from pyqtree import Index
from shapely import geometry

# box padding
radius = 0.1

# keep track of lines so we can
# recover them later
lines = []

# initialize the quadtree index
idx = Index(bbox)

# add edge bounding boxes to the index
for i, path in enumerate(paths):
    # create line geometry
    line = geometry.LineString(path)

    # bounding boxes, with padding
    x1, y1, x2, y2 = line.bounds
    bounds = x1-radius, y1-radius, x2+radius, y2+radius

    # add to quadtree
    idx.insert(i, bounds)

    # save the line for later use
    lines.append((line, bounds))
Here’s what these bounding boxes look like for the demo network:
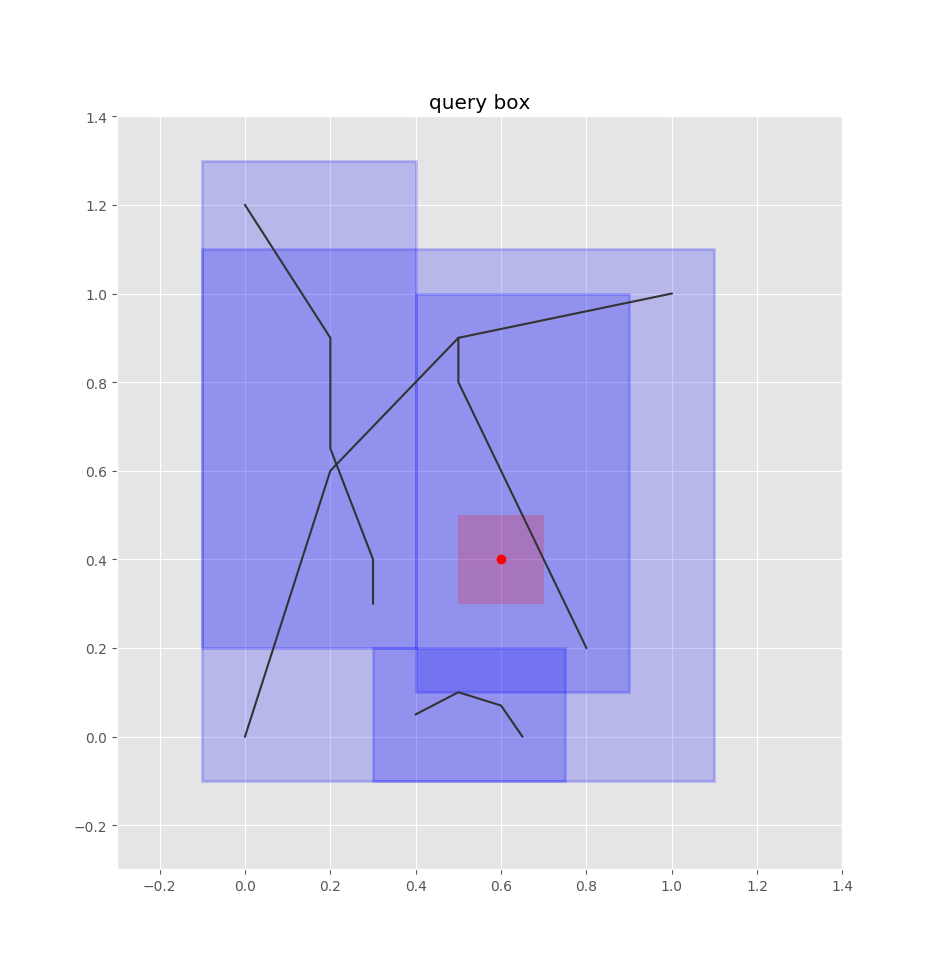
Let’s say we have a bus stop at the following red point:

To find the closest edges using the quadtree, we treat this point as a box, adding some padding to it as well:
# query point
pt = geometry.Point(0.6, 0.4)

# query box
pt_bounds = pt.x-radius, pt.y-radius, pt.x+radius, pt.y+radius
Querying the quadtree is simple:
matches = idx.intersect(pt_bounds)

Now it’s a matter of finding the closest edge. We’re using shapely’s geometry objects which have a lot of what we need built-in:
# find closest path
closest_path = min(matches, key=lambda i: lines[i][0].distance(pt))
closest_line = lines[closest_path][0]

Once we have the closest edge, we find the closest point on that edge by projecting the query point onto the edge. We don’t want an absolute position, but rather how far the point is along the edge. That is, we want a value in [0,1] such that 0 is the start of the edge, 1 is the end of the edge, 0.5 is halfway along the edge, etc. shapely’s normalized=True argument will take care of that for us.
p = closest_line.project(pt, normalized=True)
If we want the absolute point to, for example, plot it below, we can get it easily:
closest_pt = closest_line.interpolate(p, normalized=True)
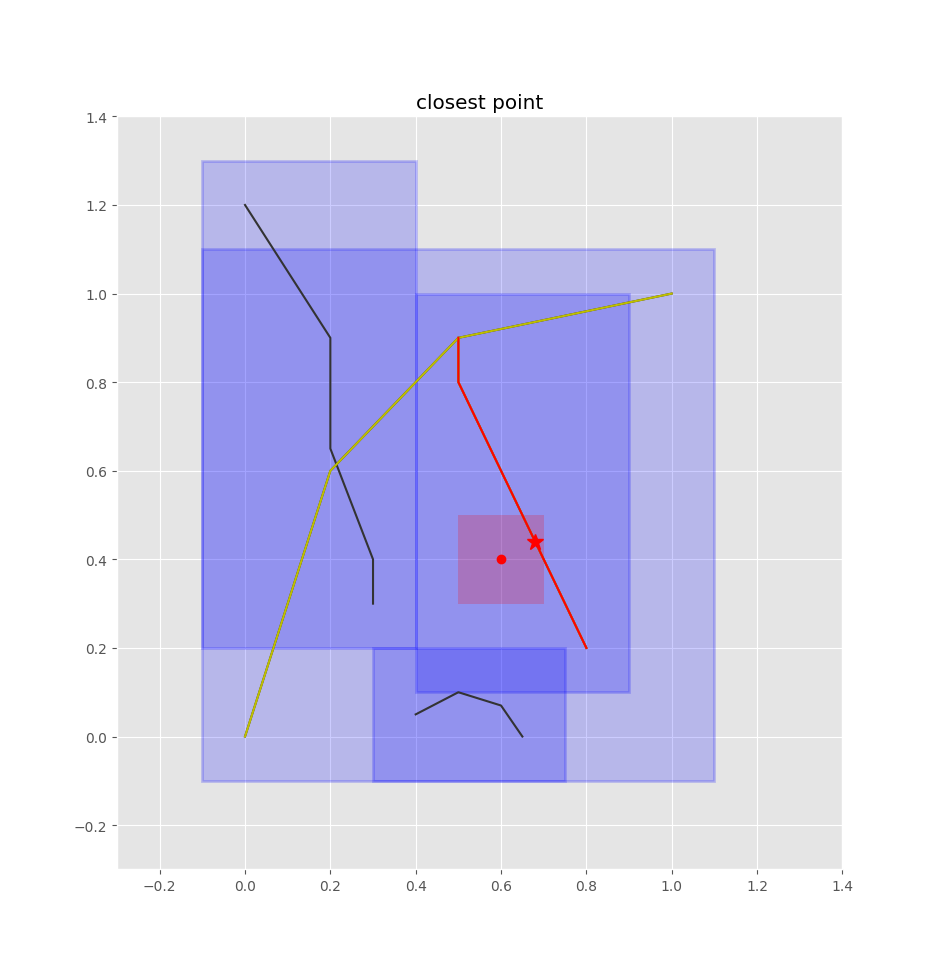
Now we have mappings of bus stops to positions along edges, which we can leverage when computing trip routes for our transit demand model.